
Being in DevOps it’s always Multi tasking. From Regular customer queries it goes through Monitoring, Troubleshooting etc. And offcourse when things breaks, it really becomes core multi tasking. Especially when you have a really scaling infrastructure, we should really understand what’s really happening in our infrastructure. Yes we do have many new generation cloud monitoring tools like Sensu, but what if we have a near real time system that can tell us the each and every events happeing in our infrastructure. Logs are the best places where we can keep track of the events, even if the monitoring tools has missed it. We have a lot of log aggregator tools like tool Logstash, Splunk, Apache Kafka etc. And for log based event collection the common choice will be always Logstash -> StatsD -> Graphite. And ElasticSearch for indexing these.
My requirement was pretty straight. Record the events, aggregate them and keeps track of them in a timely manner. Kibana uses ElasticSearch facets for aggregating the search query results.Facets provide aggregated data based on a search query. So as a first task, i decided to visualize the location of user’s who are registering their SIP endpoints on our SIP registrar server. Kibana gives us a good interface for the 2D heat map as well as a new option called BetterMap. Bettermap uses geographic coordinates to create clusters of markers on map and shade them orange, yellow and green depending on the density of the cluster. So from the logs, i just extracted the register events, and used a custom regex patterns to extract the details like the Source IP, usernames etc using logstash. Using the logstash’s GeoIP filter, the Geo Locations of the IP can be identified. For the BetterMap, we need coordinates, in geojson format. GeoJSON is [longitude,latitude] in an array. From the Geo Locations that we have identified in the GeoIP filter, we can create this GeoJSON for each event that we are receiving. Below is a sample code that i’ve used in logstash.conf for creating the GeoJSON in Logstash.
if [source_ip]  {
    geoip {
      type => "kamailio-registers"
      source => "source_ip"
      target => "geoip"
      add_field => ["[geoip][coordinates]","%{[geoip][longitude]}"]
      add_field => ["[geoip][coordinates]","%{[geoip][latitude]}"]
    }
    mutate {
      convert => [ "[geoip][coordinates]", "float" ]
    }
  }
The above filter will create a GeoJSON array “geoip.coordinates”. This array can be used for creating the BetterMap in Kibana. Below are the settings for creating a BetterMap panel in the Kibana dashboard. While adding a new panel, select “bettermap” as the panel type, and the co-ordinate filed should be the one which contains the GeoJSON data. Make sure that the data is of the format [longitude,latitude], ie Longitude first and then followed by latitude.


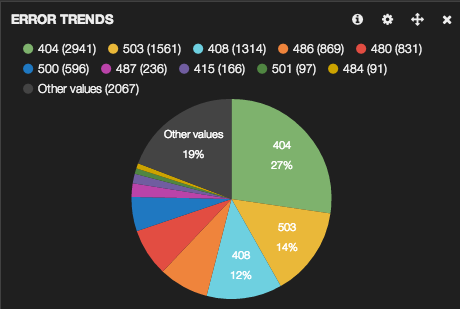
Moving ahead, i decided to collect the events happening on our various other server’s. We were one of the earliest companies who started using SIP (Session Initiation Protocol). SIP employs design elements similar to the HTTP request/response transaction model. So similar to web traffic, i’ve decided to collect events related to 4XX, 5XX and 6XX error responses, as it is very important to us. Once the logs are shipped to logstash, i wrote another custom grok pattern, which extracts the Error Code and Error responses, including the server which returned the same. These data’s can be used for future analysis also. So i decided to store these on ElasticSearch. So now we have the real time event data’s stored, but how to visualize. Since i dont have to perform much mathematical analytics with data, i decided to to remove graphite. Kibana has a wonder full GUI for visualizing the data. So decided to go ahead with Kibana. One option is “histogram” panel time. Using histogram we can visualize the data via a regular bar graph, as well as using the area graph. There is another panel type called “terms” which can be used to display the agrregated events via pie chart, bar chart, or a table. And below is what i achieved with Kibana.

This is just an inital setup. I’m going to add more events to this. As of now Kibana + Elasticsearch proves to be a promising combination for displaying all near real time events happening in my Infrastructure.

If you have any insights on how to parse IIS logs using logstash please let me know.
I never worked on iis. Would it be possible for u to provide some test logs
Are you parsing + grok’ing kamailio’s logs or are you collecting data from Kamailio some other way? If you have any kamailio log groks, I would love to see them!
Yes i’m parsing using a custom grok patterns. I just ships all the logs using Beaver to my logstash server and uses custom grok patterns. All the logs are stored on a centralized syslog server, from there Beaver takes it and ships it to logstash. Below is a sample Grok pattern
[“%{SYSLOGTIMESTAMP} %{DATA:server_details} ::: %{TIMESTAMP_ISO8601:time_stamp} %{DATA:server_type} %{PROG:program}(?:\[%{POSINT:pid}\])?: (?:\[%{POSINT:pid}\])? – INFO: : SIP PACKET REGISTER %{DATA:sip_id} ;reg-id=%{DATA:reg_id};\+sip.instance=\”\”;expires=%{DATA:ws_expiry_in_sec} from Source %{DATA:source_ip}:%{DATA:source_port} – Received on %{DATA:kamailio_ip}:%{DATA:kamailio_port}”,”%{SYSLOGTIMESTAMP} %{DATA:server_details} ::: %{TIMESTAMP_ISO8601:time_stamp} %{DATA:server_type} %{PROG:program}(?:\[%{POSINT:pid}\])?: (?:\[%{POSINT:pid}\])? – INFO: : SIP PACKET REGISTER %{DATA:sip_id} ;reg-id=%{DATA:reg_id};\+sip.instance=\”\”;expires=%{DATA:ws_expiry_in_sec} from Source %{DATA:source_ip}:%{DATA:source_port} – Received on %{DATA:kamailio_ip}:%{DATA:kamailio_port}”, “%{SYSLOGTIMESTAMP} %{DATA:server_details} ::: %{TIMESTAMP_ISO8601:time_stamp} %{DATA:server_type} %{PROG:program}(?:\[%{POSINT:pid}\])?: (?:\[%{POSINT:pid}\])? – INFO: : SIP PACKET REGISTER %{DATA:sip_id} ;reg-id=%{DATA:reg_id};\+sip.instance=\”\” from Source %{DATA:source_ip}:%{DATA:source_port} – Received on %{DATA:kamailio_ip}:%{DATA:kamailio_port}”, “%{SYSLOGTIMESTAMP} %{DATA:server_details} ::: %{TIMESTAMP_ISO8601:time_stamp} %{DATA:server_type} %{PROG:program}(?:\[%{POSINT:pid}\])?: (?:\[%{POSINT:pid}\])? – INFO: : SIP PACKET REGISTER %{DATA:sip_id} from Source %{DATA:source_ip}:%{DATA:source_port} – Received on %{DATA:kamailio_ip}:%{DATA:kamailio_port}”, “%{SYSLOGTIMESTAMP} %{DATA:server_details} ::: %{TIMESTAMP_ISO8601:time_stamp} %{DATA:server_type} %{PROG:program}(?:\[%{POSINT:pid}\])?: (?:\[%{POSINT:pid}\])? – INFO: : SIP PACKET REGISTER %{DATA:sip_id} from Source %{DATA:source_ip}:%{DATA:source_port} – Received on %{DATA:kamailio_ip}:%{DATA:kamailio_port}”, “%{SYSLOGTIMESTAMP} %{DATA:server_details} ::: %{TIMESTAMP_ISO8601:time_stamp} %{DATA:server_type} %{PROG:program}(?:\[%{POSINT:pid}\])?: (?:\[%{POSINT:pid}\])? – INFO: : SIP PACKET REGISTER %{DATA:sip_id} ;expires=%{DATA:expiry_in_sec};\+sip.instance=\”\” from Source %{DATA:source_ip}:%{DATA:source_port} – Received on %{DATA:kamailio_ip}:%{DATA:kamailio_port}”, “%{SYSLOGTIMESTAMP} %{DATA:server_details} ::: %{TIMESTAMP_ISO8601:time_stamp} %{DATA:server_type} %{PROG:program}(?:\[%{POSINT:pid}\])?: (?:\[%{POSINT:pid}\])? – INFO: : SIP PACKET REGISTER %{DATA:sip_id} from Source %{DATA:source_ip}:%{DATA:source_port} – Received on %{DATA:kamailio_ip}:%{DATA:kamailio_port}”]
Wow, quite the grok! Thanks, I’ll play with this – I presume this is just grokking standard kamailio log output, the same thing I’d consume from /var/log/kamailio/kamailio.log ?
Yes you need to make a few changes at the starting because, from my kamailio the default rsyslog pushes the log to our central rsyslog, so in the central rsyslog, it will add some extra lines like a timestamp and the IP of the server. If you see the starting of each grok “[“%{SYSLOGTIMESTAMP} %{DATA:server_details} ::: % {TIMESTAMP_ISO8601:time_stamp}” is added by the central rsyslog. So if you are fetching directly from the kamailio server then some small changes might be required. You might not need this “%{DATA:server_details} ::: % {TIMESTAMP_ISO8601:time_stamp}” part. As it applies the default syslog format.
That makes sense, yes, I would definitely want to strip that part out.
I’m having some challenges with the config file parsing when using the following grok syntax:
if [program] == “kamailio” {
mutate {
add_tag => [ “sbc” ]
}
grok {
pattern => [ “%{SYSLOGTIMESTAMP} %{DATA:server_type} %{PROG:program}(?:\[%{POSINT:pid}\])?: (?:\[%{POSINT:pid}\])? – INFO: : SIP PACKET REGISTER %{DATA:sip_id} ;reg-id=%{DATA:reg_id};\+sip.instance=\”\”;expires=%{DATA:ws_expiry_in_sec} from Source %{DATA:source_ip}:%{DATA:source_port} – Received on %{DATA:kamailio_ip}:%{DATA:kamailio_port}”,”%{SYSLOGTIMESTAMP} %{DATA:server_type} %{PROG:program}(?:\[%{POSINT:pid}\])?: (?:\[%{POSINT:pid}\])? – INFO: : SIP PACKET REGISTER %{DATA:sip_id} ;reg-id=%{DATA:reg_id};\+sip.instance=\”\”;expires=%{DATA:ws_expiry_in_sec} from Source %{DATA:source_ip}:%{DATA:source_port} – Received on %{DATA:kamailio_ip}:%{DATA:kamailio_port}”, “%{SYSLOGTIMESTAMP} %{DATA:server_type} %{PROG:program}(?:\[%{POSINT:pid}\])?: (?:\[%{POSINT:pid}\])? – INFO: : SIP PACKET REGISTER %{DATA:sip_id} ;reg-id=%{DATA:reg_id};\+sip.instance=\”\” from Source %{DATA:source_ip}:%{DATA:source_port} – Received on %{DATA:kamailio_ip}:%{DATA:kamailio_port}”, “%{SYSLOGTIMESTAMP} %{DATA:server_type} %{PROG:program}(?:\[%{POSINT:pid}\])?: (?:\[%{POSINT:pid}\])? – INFO: : SIP PACKET REGISTER %{DATA:sip_id} from Source %{DATA:source_ip}:%{DATA:source_port} – Received on %{DATA:kamailio_ip}:%{DATA:kamailio_port}”, “%{SYSLOGTIMESTAMP} %{DATA:server_type} %{PROG:program}(?:\[%{POSINT:pid}\])?: (?:\[%{POSINT:pid}\])? – INFO: : SIP PACKET REGISTER %{DATA:sip_id} from Source %{DATA:source_ip}:%{DATA:source_port} – Received on %{DATA:kamailio_ip}:%{DATA:kamailio_port}”, “%{SYSLOGTIMESTAMP} %{DATA:server_type} %{PROG:program}(?:\[%{POSINT:pid}\])?: (?:\[%{POSINT:pid}\])? – INFO: : SIP PACKET REGISTER %{DATA:sip_id} ;expires=%{DATA:expiry_in_sec};\+sip.instance=\”\” from Source %{DATA:source_ip}:%{DATA:source_port} – Received on %{DATA:kamailio_ip}:%{DATA:kamailio_port}”, “%{SYSLOGTIMESTAMP} %{DATA:server_type} %{PROG:program}(?:\[%{POSINT:pid}\])?: (?:\[%{POSINT:pid}\])? – INFO: : SIP PACKET REGISTER %{DATA:sip_id} from Source %{DATA:source_ip}:%{DATA:source_port} – Received on %{DATA:kamailio_ip}:%{DATA:kamailio_port}” ]
}
}
This refuses to pass config syntax checking – I dont suppose you can spot anything that stands out quickly that I might be doing wrong? I took your grok pattern and removed the portion of the matching pattern you suggested.
Would it be possible to send some sample logs masking the ip or putting some dummy ip’s, ill also do some test and will give modify the grok suitable to ur’s
Also could you share me the syntax in some plane text. I need to check the Double quotes at teh beginning, pattern => [ “%{SYSLOGTIMESTAMP} . Some time when we copy pastes, it may not parse properly. The first double quote looks very different from others, so had some doubts :-p
Great post! Thanks.
Hi! Would you mind sharing your Kibana dashboard?
Hi,
The Dashboards are available here
https://github.com/markwalkom/kibana-dashboards
Thank you!
Pingback: nxhack/logstash | GITROOM